
Statistical analysis is more than a set of computations
This is one of the “Ten simple rules for effective statistical practice” outlined by a group of senior statisticians (read more). As British Statistician David Spiegelhalter says in his book The Art of Statistics:
Do not just plug into formulae or run procedures in software, without knowing why you are doing so.
Being a firm believer in this myself, I decided to create an app myself using Statistical models that I believe in.
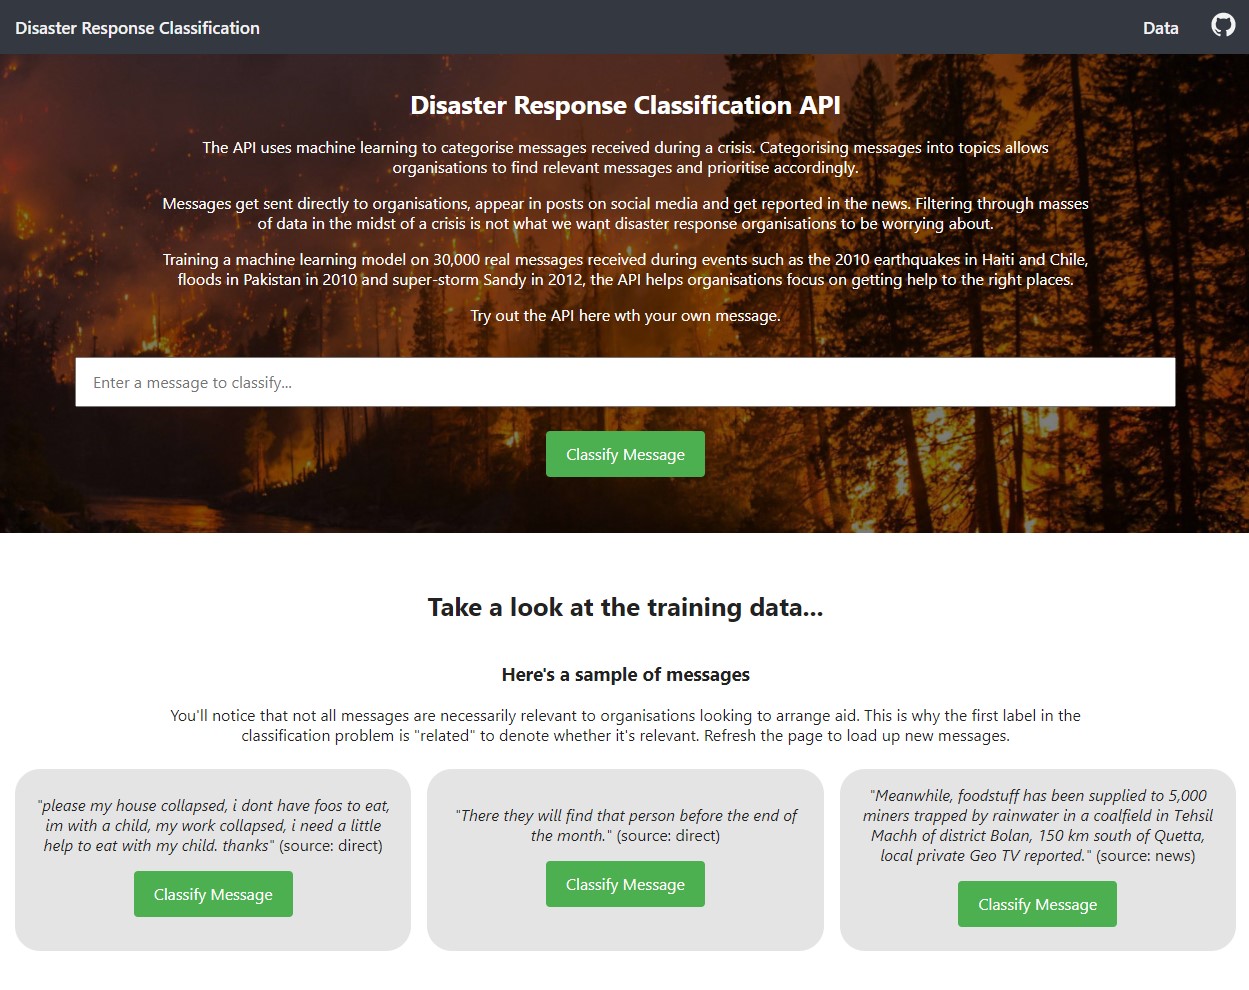
 An illustration of the app in use
It is possible to run AB tests without understanding the logic behind it. There are loads of online calculators to tell you if your test result is significant or not. Doing this without an understanding of the assumptions being made and the pitfalls of your testing approach, however could potentially lead to false or misleading results.
I have always used my own calculators and taken a keen interest in the statistics behind AB testing. I decided to create an app to share with my colleagues and help illustrate the different approaches to testing.
Frequentist vs. Bayesian
The debate between these big schools of Statistics has lasted decades with Frequentist being the generally accepted approach used in most fields such as medical trials, psychology and biology.
Students of statistics quickly come across concepts such as confidence intervals, significance, type I and II errors and the p-value. One of the reasons the Frequentist approach is so widely used is that Ronald Fischer, seen as the creator of this approach, created a p-value and very handily some thresholds to judge whether a test’s result could be used to make a conclusion or not.
A p-value of less than 0.05 is often quoted as the much desired threshold although there is a growing literature giving evidence that this is not suitable anymore and that 0.005 should be used.
Bayesian statistics is less commonly adopted. Bayesian statisticians talk of prior and posterior distributions with the prior distribution being the most controversial aspect of it. The prior distribution uses information prior to the experiment and can be subjective, if an objective prior is not available.
This is seen as more similar to how the human brain works. We have prior expectations for what we might see around us in our environment and update our prior perceptions as we come across new things.
In the case of the calculator, I decided to use a naive prior which does not influence the posterior distribution. This removes complexity from the app and with large sample sizes typically seen in AB tests, the prior has little influence on the posterior.
Why I prefer the Bayesian approach
Even without utilising an informative prior, and despite using a Frequentist approach for most of my career, I prefer the Bayesian approach.
I like the way that the probabilities are exposed and not hidden behind thresholds and assumptions. I like that there is no threshold. When you’re working with less data, it can sometimes be difficult to reach a 0.05 p-value. Using a Bayesian approach, reaching a 75% lean towards A or B might be enough to choose between two new designs.
It’s also easier to communicate. Presenting Frequentist analysis, I normally either spend a long time trying to explain all the different numbers that come with a result such as p-values, confidence intervals, alphas, betas and the like, or I just state whether it was a significant result or not.
Presenting Bayesian results, it’s much easier for a non-technical stakeholder to understand that there is a 95% chance that the new design provides a better experience.
Having said this, I still think it’s good to be able to look at both. This is why there is a toggle in the sidebar of my app to enable users to look at both approaches.
Usage
Using the app is fairly self-explanatory.
At Eurostar, it was used to enable teams to be able to look at test results themselves. Particularly for the content editors who wanted to trial different content for the different markets.
Using the Bayesian approach here where traffic levels might be low but the tests are low risk, it was possible to make decisions using less data and with a greater understanding of the risk.
Creation
I normally analyse my tests in a Jupyter Notebook, checking for any sign of foul play in the data before checking significance levels.
I decided to use Streamlit to move the significance calculations to an app. I chose Streamlit over Dash simply for it’s ease. Having already created plots in Matplotlib and Seaborn, creating a Streamlit app took no time at all and it was a simple step to put this onto Heroku.

