
Like everyone, and maybe more than most, I’ve been following closely along with news of lockdowns, waves, travel corridors, tier systems and all the other unprecedented stuff. With my girlfriend being in France while I’m here in the UK, I’ve been particularly interested in what’s going on in and between the two countries.
Knowing whether cases were going up or down allowed me to plan visits to head over to France and for the last few months, we’ve been waiting for the situation to allow for me to move over to France to stay there.
I created my own dashboard displaying simple trend numbers for the COVID-19 situation so that I had one simple place where I could see everything.
 The app in use
I wanted to be able to see a moving average to account for reporting inconsistencies. I wanted to be able to zoom in to graphs to be able to see more granularly what’s been going on in the last week or month. With most dashboards still presenting data as a year long time-series, it has become a lot harder to see the little bump indicating that the top of a wave might be reached.
Technology Used
Flask
Flask is one of the simpler frameworks for creating web apps. This is with the exception of Streamlit which I’m a huge fan of but generally works with single pages only.
Plotly
It was important to me that the plots be interactive. Plotly is one of the easiest to use and most interactive out-of-the-box visualization libraries that I know of.
Further, Plotly works so well with JavaScript that adding features such as synchronising the zoom between the plots on my dashboard can be added easily.
Native CSS - no Bootstrap
In the end, I decided to use CSS Grid and Flexbox to hand the layout and responsiveness of the application. I did initially add Bootstrap to the app but decided against using it for multiple reasons:
- I was using so little of Bootstrap’s heavy library
- It relies on jQuery - I loved using jQuery back in 2012 but it’s unnecessary now with updates to JavaScript
- I felt more comfortable using Flexbox and Grid throughout
UK Gov API
Brilliant and well-maintained from the UK government with very generous usage limits. It was very simple to pull out data for the UK with options to be a lot more granular.
Deployment
I normally use Heroku to deploy web apps but decided to utilise PythonAnywhere this time. It is highly suited to running Flask and Django apps and the free tier includes one app with paid plans coming in at around $5 a month.
Another reason for not using Heroku is that under the free tier of Heroku, apps go to sleep after 30 minutes of inactivity. This means that opening the web app beyond this can take an extra 5-10 seconds, more than enough time to give up opening it.
Future Updates
Whilst I’m keen to keep the app light and simple, there are a few potential additions I may make:
- Design improvements
- Total case and death numbers
- Vaccine information - whilst not readily available currently with the UK only just having published daily numbers (as of 11th Jan 2021) in an excel sheet, it is certainly the next number to watch
- UK and France Coronavirus news widget using a news feed API
- Ability to toggle the countries selected - the WHO data supplies data for the world (naturally). A list of potential countries with data to pull could be added. Although this does take the dashboard away from its initial purpose at least of being a way to see the situation in the UK and France
Source code
See the app live here.
Alternatively, view the Github repo.

Docker images vs. containers - how I explained it to myself
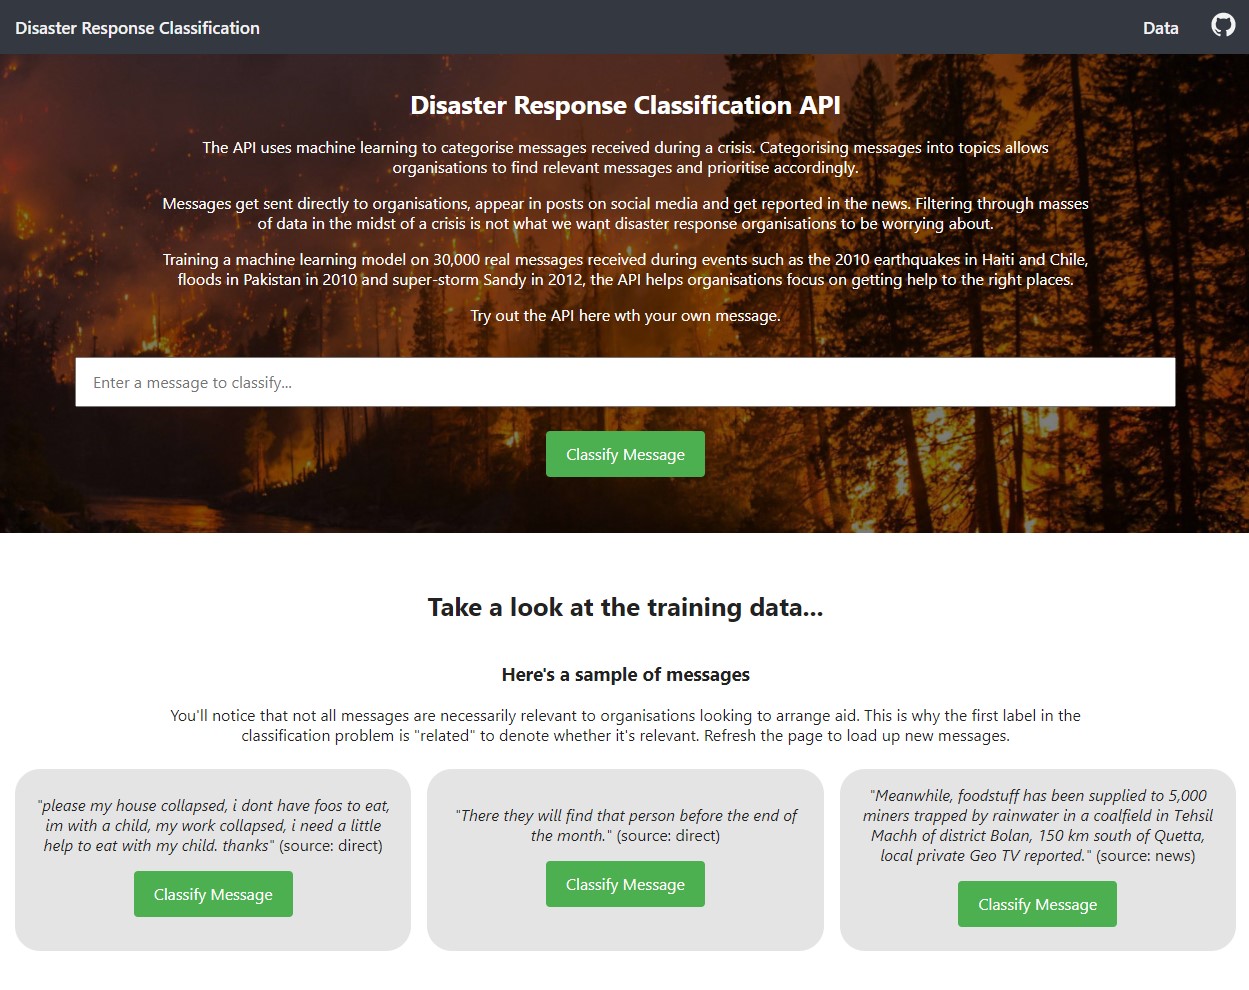
Disaster Response Classification API

