
Frequently having to calculate sample sizes for AB tests, I decided to create my own application for this, originally in a Jupyter Notebook and later as an app hosted on Heroku and built using the Streamlit framework.
Creating an app and hosting it on Heroku allowed me to quickly calculate sample sizes through a tool of my own making without having to fire up Python first.
Being able to interact with the calculator also makes it easier to illustrate things to consider when scoping out tests. The calculator makes it easier to understand how traffic levels and conversion rates interact with test precision and run times.
Using Streamlit, it was a simple transition going from a Jupyter Notebook to a Streamlit app. The harder part came through finding a reliable formula for calculating sample sizes and outputting a format that was meaningful and useful to me in my job as a digital optimisation manager.
A meaningful output
Most sample size calculators return a total number of visitors needed per variation required to detect a certain effect size or minimum detectable effect (MDE). You take this information and work out what it means in relation to the traffic you see on your site.
More useful to me is understanding what sort of precision I can achieve with my test in a reasonable amount of time, based on my traffic levels.
Therefore the graphical output I chose displays precision/MDE vs. runtime. Example output:
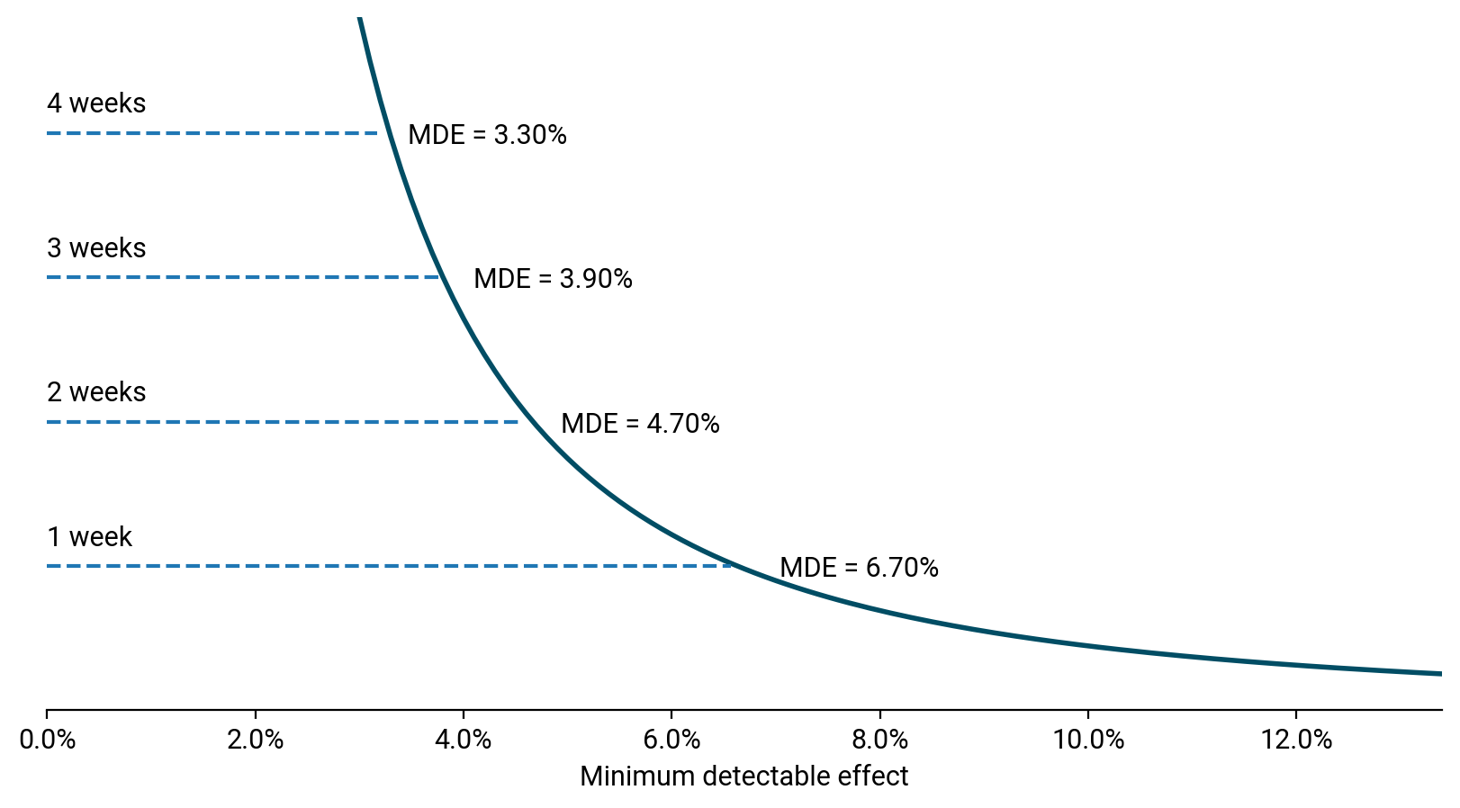 A plot of runtimes vs the minimum detectable effect (MDE)
This works for multiple scenarios when testing:
-
Standard optimisation test - We want to test a new feature/design and need to understand whether we have enough traffic to test the change. The graphical output of runtimes vs. MDE quickly allows us to consider whether we might be able to drive enough of an impact through the change to allow us to run the test in a reasonable amount of time.
-
Do no harm tests - Maybe the team need to make a change for functional reasons and they want to ensure they are not having too significant an impact on KPIs. In this scenario, the lower the MDE the better. The trade-off is the time it takes to run the test.
Hosting the app on Heroku
Heroku provides a simple and free platform for hosting applications. The only drawback is that under a free account, you can host only two apps on the platform and the apps will ‘sleep’ after 30 minutes of inactivity.
This means that the app will take a good 5-10 seconds to wake up if it hasn’t been used before this. This doesn’t provide the best experience for people wanting to make a quick calculation.
Usage
The app was used by myself and colleagues while at Eurostar to quickly calculate runtimes and also to understand the business value behind tests.
Adding the average value of a conversion outputs a monthly revenue impact based on the impact seen. This quick calculation allowed the team to prioritise between different potential changes at a time when the team had limited developer resource to run tests.
In the case of do-no-harm tests, it allowed the team to see the potential revenue loss if the test does have an impact. At a time when traffic levels are low due to less demand for travel during the pandemic, understanding quickly the level of precision achievable and the business impact was key.
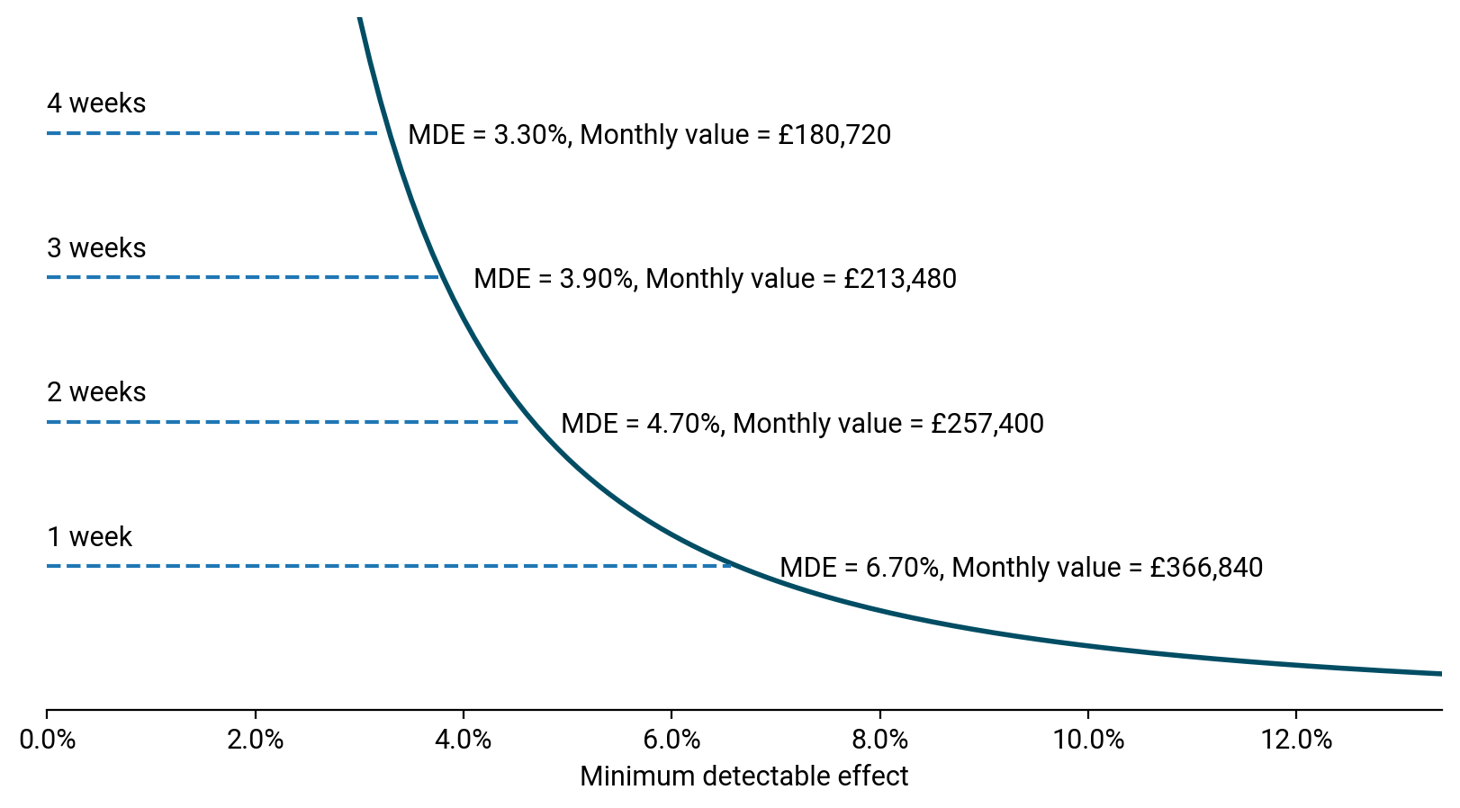 Attaching the business value associated with the different MDEs or runtimes

Reduce your Heroku slug size
Creating an AB test calculator with both Frequentist and Bayesian approaches
