
There are many statistical methods for rejecting or failing to reject a null hypothesis. I want to run through Permutation tests and when you might use this method.
A lot of statistical methods require making bold assumptions about the data and knowledge of their parameters. Permutation testing does away with only a couple of simple assumptions necessary and it’s non-parametric.
 Photo from WikiHow
An example (with code)
Let’s say that we have run a classic AB test on a website. We are running tests for a travel website and want to test two different versions of a homepage to see which encourages more visitors to book holidays. We therefore want to increase the conversion rate for the website.
During the test, we had 20,000 total visitors with a miraculously even split in vistors giving exactly 10,000 visitors to either experience.
A has seen a conversion rate of close to 20% and B has seen a conversion rate of close to 22%. Is this a statistically significant result?
To find out, let’s first simulate these results using the scipy.stats Bernoulli function. We use the Bernoulli function here because, with 20k visitors, we have essentially run 20k Bernoulli trials where we have a binary outcome - holiday booked or not.
# Creating the data for A and B
n = 10000
data_A = scs.bernoulli(0.2).rvs(10000, random_state=42)
data_B = scs.bernoulli(0.22).rvs(10000, random_state=42)
This gives us
- A’s conversion rate: 19.62%
- B’s conversion rate: 21.40%
- Difference: 1.78% absolute or 9.07% relative
How do we test the significance of this 1.78% increase with a permutation test?
Null Hypothesis
Our null hypothesis is that there is no difference between the two conversion rates. Alternatively, we can state our null hypothesis as such
H0: There is no difference between the means
To test this hypothesis, we will create multiple permutations from data which satisfies this null hypothesis. What this means is that we will effectively create datasets, randomly, where the difference between the means is the same. To do this, we group our data for A and B and their conversions.
Creating our permutations
To help visualise this, imagine each visitor to our AB test as either a 0 or a 1. 0s are those that chose not to book a holiday on our site and 1s are those that did. We pile these 0s and 1s into massive hall and tell them to run around randomly. At this point, we have created one big group of 20k people where the percentage of holiday bookers is no longer 19.62% or 21.40%, but instead 20.50%.
We now set up two desks at either side of the hall, one being a desk for A and the other B. Each desk randomly selects someone from the hall and registers whether they are a 0 or a 1. Once a person is selected, they are thrown back into the mix meaning they can be picked again as many times as chances allow. This is permutation with replacement. This is done until each desk has logged 10k 0s or 1s each. We now have an A and a B which satisfy the null hypothesis. There is no difference in the means between the new A and B because we drew them from one big group with mean 20.50%.
However, we will work out the difference between the means of the new A and B and log this. This is a permutation replicate. A permutation replicate is the test statistic calculated for a permutation. The test statistic of interest here being the difference in the means.
We now recreate this permutation process many many times - normally many thousands of times.
To create a single permutation, we can use the following function.
def permutation_sample(A, B):
    """
    Create random permutations of two datasets and return new permuted datasets

    Parameters:
    A (array): dataset for control
    B (array): dataset for variant

    Returns:
    permuted_A, permuted_B
    """
    data = np.concatenate([A, B])
    permuted_data = np.random.permutation(data)
    permuted_A = permuted_data[:len(A)]
    permuted_B = permuted_data[len(B):]
    return permuted_A, permuted_B
To create multiple permutations and calculate our test statistic, we use the following function:
def draw_permutation_replicates(A, B, func, size=1):
    """
    Creates an array of permutation replicates from the given datasets
    by permuting them 'size' times.

    Parameters:
    A (array): dataset to compare against B
    B (array)
    func: this is the function that will give out the desired test statistic.
            Must be able to take two arguments.
    size (int): how many permutations to test against

    Returns: array of permutation replicates
    """
    # Initialise an empty numpy array
    perm_replicates = np.empty(size)
    for i in range(size):
        perm_A, perm_B = permutation_sample(A, B)
        perm_replicates[i] = func(perm_A, perm_B)
    return perm_replicates
draw_permutation_replicates requires a function to produce the permutation replicate. In this case, our test statistic is the difference of the two means, so we create a simple function for this.
def diff_of_means(data_1, data_2):
    """Difference in means of two arrays."""
    diff = np.mean(data_1) - np.mean(data_2)
    return diff
The result
We have finally got our permutations. We decided to create 10,000 permutations. With this we can plot the distribution of the permutation replicates for visualisation.
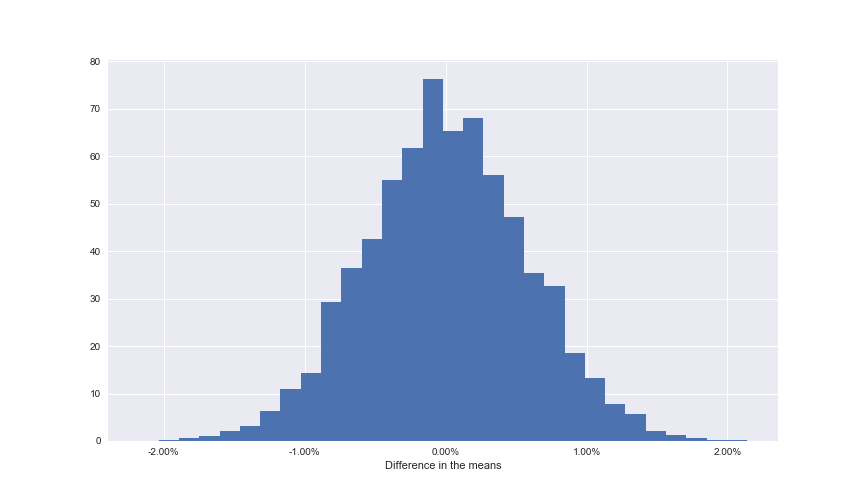 Distribution of the permutation replicates
The final step here is to work out how the original difference of the means of 1.78% compares to the permutation replicates. This means calculating the p-value. It’s calculated as the percentage of permutations that had a higher difference in their means compared to our empirical difference of the means.
Note: The empirical difference of the means is the statistically accurate way of stating the difference of the means calculated from the data, not through theory or other means.
We calculate this with the following code.
empirical_diff_means = diff_of_means(data_A, data_B)
perm_replicates = draw_permutation_replicates(data_A, data_B, diff_of_means, 10000)
p = np.sum(perm_replicates >= empirical_diff_means) / len(perm_replicates)
# Print the result
print('p-value =', p) # Output = 0.001
This means that from our 10,000 permutations, 10 of them had a difference of means greater than 1.78%. Again, to visualise this graphically, we can plot this to our distribution.
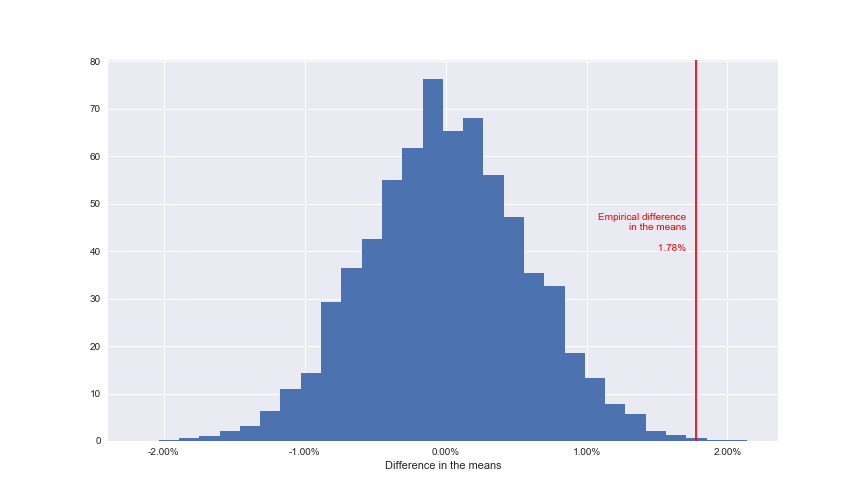 Only a very small percentage of permutations had a result more extreme than the recorded one
We can see that in graphical terms, the p-value represents the amount of data that sits to the right of the line.
Assuming that we set our \(\alpha\) at 0.05, as is industry standard and should be defined prior to running the test, this means that we would reject the null hypothesis providing we see a p-value of either greater than 0.975 or less than 0.025 (these represent the extreme tails of our distribution).
Therefore since 0.001 represents strong evidence to reject the null hypothesis and conclude that there is a significant difference between the conversion rates of experiences A and B.
.png)
Matplotlib graph: deaths per day in the UK due to Covid-19
Book Review: Thinking Fast and Slow by Daniel Kahneman

