Maybe you have a place that you’re fortunate enough to be able to potentially put on Airbnb but you’re not sure if it’s worth the hassle. With Airbnb making host listing data publicly available, we can break down the nightly prices to understand what factors influence how much you can charge.
We’ll go through that here, providing an easy guide to get a rough idea for how much to charge if you have a place you can rent out. We’ll also look at what are the key factors involved. The data is specific to Boston, however, much of the information in this post will give you a good idea for things to think about for any location.
 Photo via Getty Images/Through the Lens
Note: Airbnb also gives pricing tips based on much more sophisticated models than I can accomplish here (more details). Use this post though for a very rough guide to get you started.
Alternatively, the findings from this post apply to those looking to understand which filters to play around with when trying to find a cheap (or expensive?) place, other than using the price filter on the search page ¯(ツ)/¯.
The factors we’ll be looking at
We’ll use two datasets given by Airbnb:
- calendar.csv - listings with dates detailing whether they’re available or not and how much they cost to rent on each date.
- listings.csv - lots of information about each listing including text descriptions, host details, number of bedrooms, bathrooms, location and more.
We merge the two datasets to provide one informative dataset that we can work with. Some of the features:
- Neighbourhood
- Property type, e.g. house, apartment, dorm, etc.
- Room type, i.e. entire place, private room or shared room.
- Time of the year
- Number of bedrooms, bathrooms, beds
- Information about the host such as number of listings, response time, location, superhost status
- Number of reviews and average rating
- Amenities
- Cancellation policy
Cleaning and manipulating the data into a format we can use takes up much of the time invovled in a project such as this but we’ll move swiftly on to more exciting things.
Dropping listings without reviews
Since we want to find a price for our new listing that travellers will think reasonable, we’ll focus on the data for only the listings that are “successful”. We’ll remove listings without a review.
This has the added benefit of removing a few listings that some might define as outliers. Outliers can greatly impact a model’s ability to make accurate predictions (linear regression is particularly sensitive to outliers) but shouldn’t be removed just to make the data fit better. Data may look like outliers but unless if there has been an obvious mistake somehow, they are valid and shouldn’t be excluded.
What are the most important factors?
Without any fancy statistical models, some factors stand out as key in pricing your listing. The plots below provide a birds-eye view of some of the features. Pay attention to the scales used in these plots to understand the magnitude of the impacts.
Note: click on the plots to to be able to get a closer look.
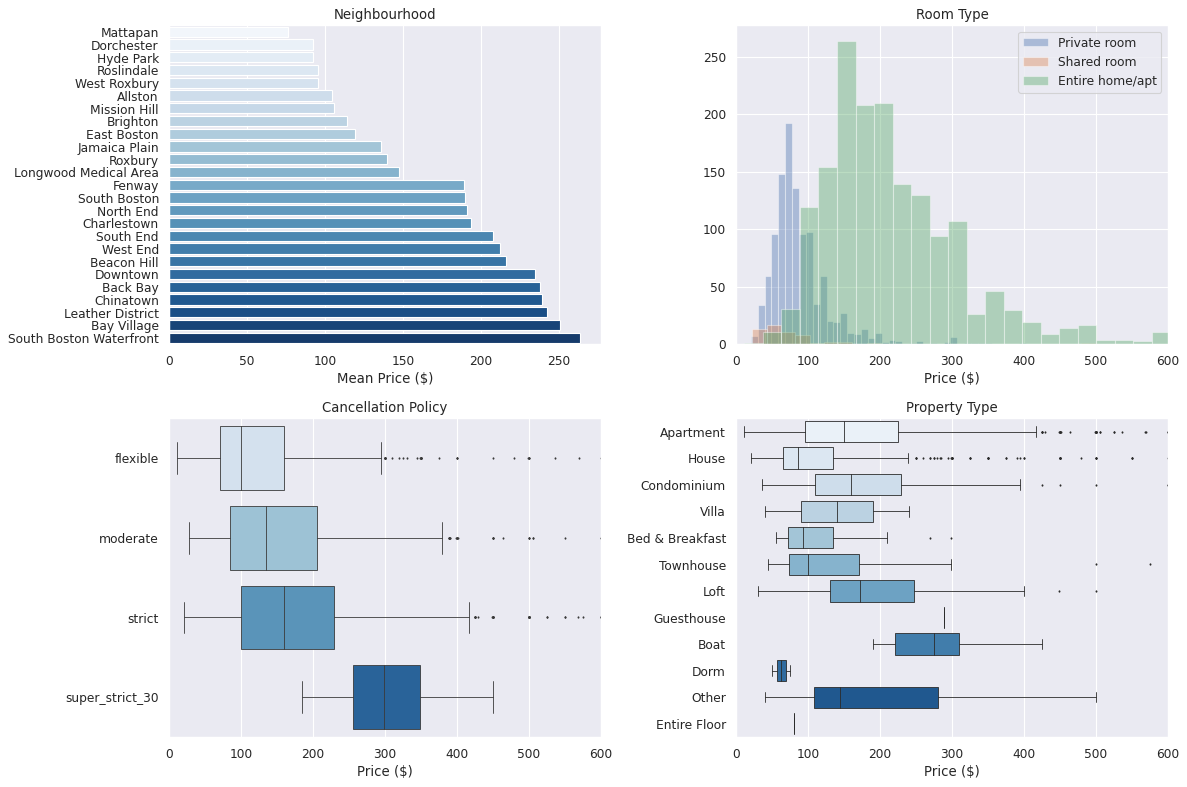 The impact of some of the features on the listed price
Things we can spot:
- The type of listing has a clear impact with shared and private rooms never reaching the higher prices that you can charge when renting out your entire home/apt
- The location of your property is important but maybe not as important as some of the other features
- Properties with a strict cancellation policy tend to come with listings charging a higher price - but these listings also tend to have less reviews (not shown here)
- The number of bedrooms has a huge impact on the price you can charge - 5-bedroom properties have an average price of $600 a night vs less than $200 for studios or 1-bed properties
- The average nightly price varies by $20 depending on the time of the year with late summer/autumn being the most expensive months
 Some more features
Not displayed here to try and keep the post length to a minimum are plots showing the relationship between the descriptions given by hosts about their listings and the price. That’s because the plots don’t show any relationship at all. There’s no evidence that the length of a description about your space, neighbourhood, or transport options impact the price that a listing can be put up for. Of course bear in mind that here we boil a potentially enchanting description down into a character count. In this format, the amount of information you give about the space, transit options, the neigbourhood, house rules and more all have no impact on the price you can put the place up for.
How can you calculate a price?
To enable us to add tangible values to the differnt factors and create a formula for estimating a good price, we’ll plug the data into a linear regression model. Linear Regression is one of the simplest statistical modelling techniques but also one of the most easily interpreted.
Fitting the data with a linear regression model, we are able to account for 60% of the variability in price. We might be able to account for more with a more sophisticated model but for a ballpark price to work with, this suits our needs just fine. The ballpark price comes with a fair amount of wiggle room, on average around $100. This means that we need to bear this in mind when considering what to charge.
Our prediction effort is certainly not going to be winning any competitions but a key strength to linear regression is that it returns coefficients for each of the features. These coefficients tell us the impact of each of the features in an immediately interpretable form. Below, I’ve pulled out the key features identified by the model.
Calculating a price
The way to use the graphs below is to go through each of the different features and add/subtract the coefficients together to get a rough idea for what price to put your Airbnb up for. To this you then need to add the ‘intercept’ of the model, in our case \(-\$86\). That means you need to subtract \(\$86\) from the final price.
Similar to the trends we saw before, key features are the number of bedrooms, the neighbourhood, type of property and room and the time of the year. Your status as a local or an Airbnb superhost also can have some impact on the sort of prices travellers will pay.
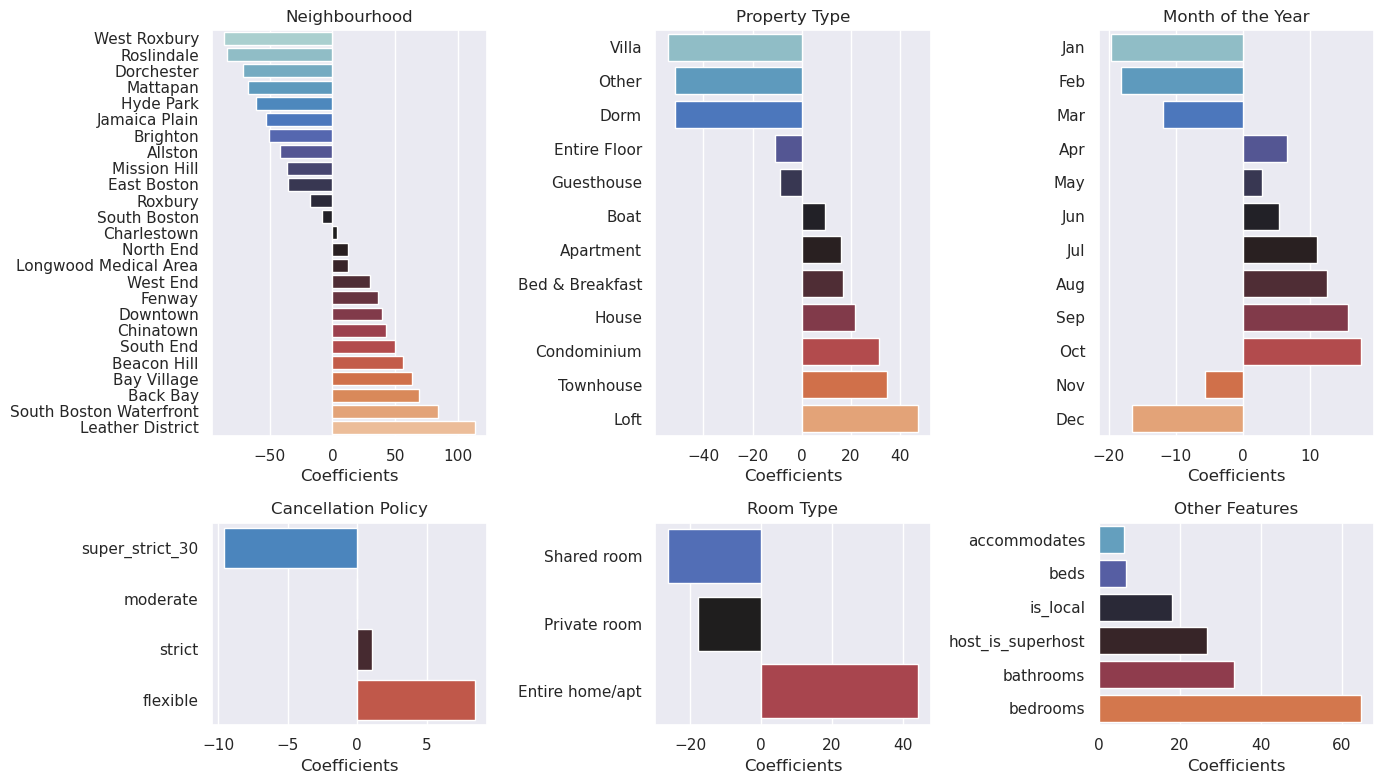 Use the features and numbers here to calculate a ballpark listing price
An example
For example, say I have a two bed apartment in South End that I want to rent out in January. I would calculate
- \(+\$50\) for the South End neighbourhood
- \(+\$20\) because it’s an apartment
- \(-\$20\) since January is a cheap month
- \(+\$0\) because I want to use a moderate cancellation policy
- \(+\$42\) since I’ll rent out the whole apartment
- \(+2\times\$63\) for the two bedrooms
- \(+\$35\) for the one bathroom
- \(+3\times\$6\) for the three beds (there’s a sofa bed)
- \(+6\times\$6\) since the place accommodates 6 people
- \(-\$86\) for the intercept
Therefore the model says I should put the place up for a price around \(\$221\) a night. Again, bearing in mind the potential error margin here, I might think that my apartment is in a particularly nice part of South End and want to push the price up a bit. Or maybe it’s a bit of a cheek calling it a two-bed and knock a few dollars off.
Feel free to go through this yourself to see how much you might put your place up for.
There are some clear drawbacks to this approach. For one thing, it’s possible to plug in data to return a negative listing price implying that you should pay someone to come and stay in your dorm in West Roxbury in December. However, whilst Linear Regression in this case may not be the best method to accurately predict listing prices, it does provide an easily interpeted model that can be used (at least in some form) without even needing to use anything other than a pen and paper.
Checking the most important factors
Linear regression has provided a sensible way for us to calculate a price. However, with only 60% of the variation accounted for using a linear model, let’s see if we can improve on this using some more sophisticated models.
To pick out any potential non-linear relationships the data, we’ll use a couple of tree-based ensemble methods. Tree-based methods give us the flexibility to fit non-linear relationships but they also tend to be very sensitive to small variations in the data. This is why we’ll use ensemble methods to reduce this tendency to overfit. Tree-based methods also tell us clearly the key factors in picking a price.

Using Random Forests and XGBoost, two very popular competition winning machine learning methods, using the same factors as before, we can account for over 90% of the variation in the data and make much better predictions. However, their high complexity make it impossible to pass on the model without Python installed on your machine.
It is simple enough however to show the most important factors in pricing your Airbnb according to the data.
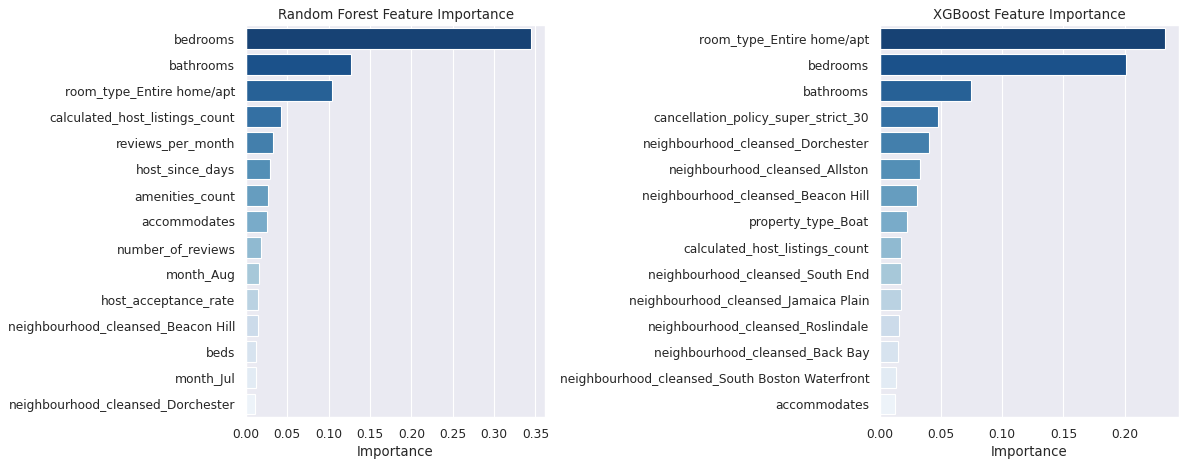 Feature importance of the ensemble methods
Both ensemble methods are aligned that the number of bedrooms, bathrooms and whether the listing is an entire home/apt or not are the most important features. These features account for 57% of the importance using either of the two ensemble methods, showing just how closely they agree. The rest of the features are each given small weights in adding the total up to 100%.
This supports the earlier model we used and both suggest that it’s really the most fundamental features of your home/apartment/loft/etc. that influence the price you should put it up for. All of the models used, simple or complex advise a significant margin for error in making an estimate suggesting that there are factors not captured in our data.

Conclusion
We managed to account for 60% of the variance in Airbnb prices with our features using a straightforward linear regression model. Through this we are able to provide a method for calculating a good starting point to price your Airbnb at. The more sophisticated methods got a bit more exact and were aligned on the most important factors but all of them agree that the estimates are not perfect and that there is unaccounted for variance in the data.
There will always be that Je Ne Sais Quoi
While our models do a great job at generalizing prices based on features, each listing is unique and what makes a traveller decide that your place is worth the money comes down to many features we won’t be able to capture, although Airbnb do their best with their model.
Airbnb’s suggested price when you start the process for renting your place out is much more sophisticated than ours, taking into account far more granular features and using clustering techniques. But it still can’t see the amazing feng shui you’ve got going on in your bedroom or the hanging plants in the hallway. Maybe your description of your space and the neighbourhood is particularly enchanting to travellers.
The best method for finding the right price to charge is most likely trial and error, using the findings here and Airbnb’s suggested price as guidelines. Try various prices and see what works.
See the code
If you’d like to see the code behind the data, it’s available on Github and also on Kaggle.


