
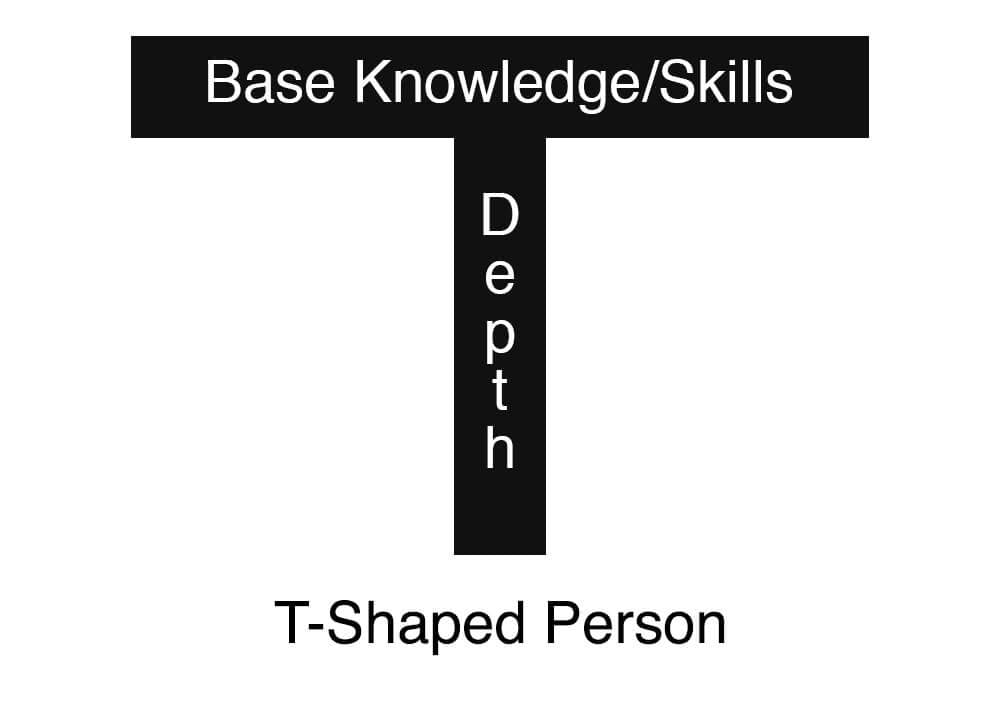
A T-shaped person is someone who is capable in many things and an expert in at least one. This is a phrase I learnt about recently and I like to think it justifies the meandering way that I go around in my passion to learn.
I am regularly falling down the rabbit hole on random topics such as django, jekyll, JIRA query language, Powershell use and more. These are skills that I will sometimes learn for a few days or a week and then use infrequently or not at all.

I’m able to do this currently whilst I am away from deadlines and work pressures. I pursue anything that I enjoy and I enjoy the the process of learning as much as anything. I’m not becoming a master in many of the things I’m doing. I am learning for the explicit purpose of applying it to solve a problem or complete a task I have and then putting it aside when it’s no longer needed.
The need for ‘I-shaped’ people is rarer today than in the past, especially in the tech/web industry. You don’t only want an expert in data analysis methods, you want an expert in data analysis with some business strategy, communication skills, ML knowledge and data vis. There’s little use for an expert data analysis who doesn’t know how to provide answers to questions the business needs answered.
Discovering this term for a ‘generalising specialist’ makes me feel much better about this shallow knowledge grab of anything that I find interest in. One day this may allow me to best help my team by working on something I have ‘some’ knowledge on if that is where the bottleneck is perhaps.
For me, I would say my specialities are generally data analysis, optimisation, statistics and communicating my work. My breadth of non-specialist knowledge at this point stretches across data vis, programming knowledge, data science and business acumen. I would like to deepen my knowledge of data science and data vis and add knowledge of database infrastructure to my broader knowledge.
7 basic git commands to get you started
Matplotlib graph: deaths per day in the UK due to Covid-19
.png)


